Using SQL Server Activity Monitor to Learn About Resource Waits
Dan Sales#Hosting, #Hosting Insights, #Tutorials

SQL Server implementations can be complicated, but by using the tools available to them, Systems Administrators can find the information they need to manage their SQL Server instances and ensure that they are operating correctly. In my recent blogs, I’ve provided an overview of SQL Server Management Studio Activity Monitor and gone into more detail related to finding and understanding expensive queries being run against SQL Server. In this blog, we’ll look at SQL Server resource waits and one of the dynamic management views.
What Are Resource Waits?
When SQL Server processes a query (or, to use a more correct term, a thread), it uses the resources of the system it’s running on to do the work. If all the resources needed by the thread are not readily available, then the thread will move into a waiting or suspended state until those resources are made available. The time threads spend in this suspended state and the resources they are waiting for is tracked by SQL Server and referred to as “waits” or “wait stats.”
Before we look at resource waits and dynamic management views in more detail, I want to point out two key things you need to know about waits:
- There are many types of SQL Server waits. In fact, there are so many that there are online libraries dedicated to them and what they represent. For more information on wait types, I would recommend taking a look at the SQL Server Wait Types Library, which, at the time of this writing, lists 898 types of waits.
- There will always be waits within SQL Server. It is the nature of relational database management systems to have waits, so you shouldn’t get hung up on the fact that SQL Server is tracking waits. What we are really looking for here are waits that impact the performance of the applications running on SQL Server.
Viewing Resource Waits
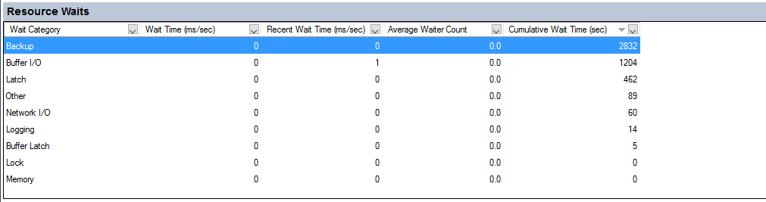
When troubleshooting the performance of an application running on SQL Server, if I want to see whether any waits within SQL Server may be to blame, I start with the Resource Waits pane of Management Studio Activity Monitor. This will give me a high level overview of what’s happening related to waits in the SQL Server instance.
Below is a screen shot of the Resource Waits pane showing what I would consider a healthy instance in which I would not spend much time looking into waits. There are few active waits, and cumulative Backups waits being at the top makes sense for the backup plans we have in place for this instance.
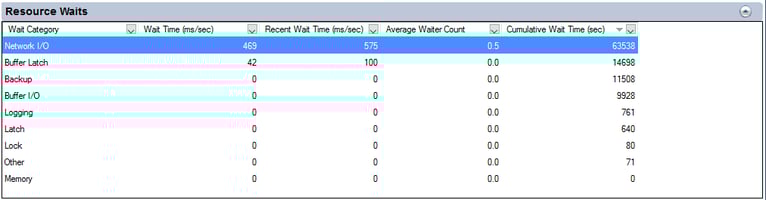
On the other hand, the next screen shot shows an instance that I would want to investigate with regards to waits. We can see a high number of active and recent wait times related to Network I/O and Buffer Latch waits, along with high Cumulative Wait Time numbers for both of these categories of waits.
Investigating Resource Waits
To get more information related to the waits in the second example, I like to use the dynamic management view sys.dm_os_wait_stats. This view is one of a number of built in dynamic management views (DMVs), which, along with built in dynamic management functions (DMFs), make up what are commonly called SQL Server dynamic management objects (DMOs). DMOs can be used to get many kinds of data about what is going on with a SQL Server instance.
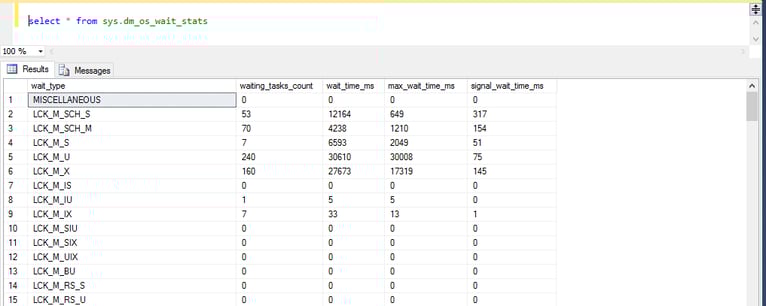
It’s not hard to get the raw data from the sys.dm_os_wait_stats DMV, and all that needs to be done is to write a select statement. The issue with some DMVs, like the sys.dm_os_wait_stats view, is that the raw data may not tell you what you really want to know. Let’s look at some simple examples on how to get the raw data for the sys.dm_os_wait_stats view, and at the end of this blog, you’ll find a few links with more complex TSQL statements that can help make the raw data more meaningful.
The columns in the sys.dm_os_wait_stats view are:
- wait_type - Name of the wait type.
- waiting_tasks_count - Number of waits on this wait type. This counter is incremented at the start of each wait.
- wait_time_ms - Total wait time for this wait type in milliseconds. This time is inclusive of signal_wait_time_ms.
- max_wait_time_ms - Maximum wait time on this wait type.
- signal_wait_time_ms - Difference between the time that the waiting thread was signaled and when it started running.
To output all the data from the sys.dm_os_wait_stats view, a “select all” statement can be used which will return all the data in the view in the order it is stored. This provides the data but requires you to scroll through all the results to find what you are looking for.
By adding an “order by” clause to our select statement, we will be able to see the data we want at the top of the view. I like to order by the total number of waiting tasks or the total amount of wait time in milliseconds in descending order.
Order by total number of waiting tasks:
select * from sys.dm_os_wait_stats
order by waiting_tasks_count desc;
Order by total amount of wait time in milliseconds:
select * from sys.dm_os_wait_stats
order by wait_time_ms desc;
The data is the sys.dm_os_wait_stats view is cumulative, so it can be helpful to clear the data in the view to get only current data. This can be done with the following statement:
DBCC SQLPERF ('sys.dm_os_wait_stats', CLEAR);For more complex and informational TSQL statements for the sys.dm_os_wait_stats DMV, I recommend reading the following:
SQL Server sys.dm_os_wait_stats DMV Queries
Wait statistics, or please tell me where it hurts
SQL Server Performance Tuning Using Wait Statistics: A Beginner’s Guide)
The Resource Waits pane of Management Studio Activity Monitor provides general information on waits and the areas in which these waits are occurring. The sys.dm_os_wait_stats DMV provides detailed data on all the cumulative waits in the instance by wait type. With these two tools and some TSQL statements, we can start to dig into why there are wait related issues within a SQL Server instinct.
In the next part of this series, I will look at how to run a SQL Server trace and what information we can get from doing so. If you have any questions about SQL Server or any tips of your own that you would like to share, please feel free to leave a comment below. If you want to know more about Diagram’s hosting services, please contact us. We hope you’ll join us for the next installment in our series of blogs about SQL Server!
Related Posts

The 3 Main Types of SSL Certificates to Know
Learn about the 3 main types of SSL certificates to help you decide which one is best for your business.

Why Do I Need an SSL Certificate?
Without understanding what an SSL Certificate is, it may be hard to realize why this is so important for your website. In this blog Diagram will cover both of these topics.
Results Matter.
We design creative digital solutions that grow your business, strengthen your brand and engage your audience. Our team blends creativity with insights, analytics and technology to deliver beauty, function, accessibility and most of all, ROI. Do you have a project you want to discuss?

Like what you read?
Subscribe to our blog "Diagram Views" for the latest trends in web design, inbound marketing and mobile strategy.