Using Datadog For Cloud Scale Monitoring With Amazon Web Services
Tom Bennett#Hosting

As the native monitoring system provided by AWS, CloudWatch provides some powerful monitoring tools, but we’ve found another solution that gives even more detailed data and offers some versatile integration tools: Datadog. Let’s look at the value it provides to AWS users:
Datadog Agent
Datadog is able to provide more detailed, granular reporting through the use of the Datadog Agent, a piece of software that runs on your AWS systems. The Agent collects data and sends it to Datadog, where it can be compiled into useful dashboards and reports to provide insight about all of the services and applications that you are using. The Datadog agent improves on the monitoring provided by CloudWatch by checking data every 15 seconds, whereas CloudWatch checks data every 1 minute.
Multiple Integrations
In addition to monitoring AWS systems, Datadog also integrates with a wide variety of other systems, including cloud computing providers like Google Cloud Platform and Microsoft Azure, search providers like Solr and ElasticSearch, source code control tools like GitHub, and project management and collaboration tools like Jira and Slack. By combining data from multiple systems, users will be able to get a complete picture of all of their web properties at once.
Tagging
One of the most powerful capabilities that Datadog provides is a tagging system for the AWS resources and applications that it monitors. Systems can be assigned tags for their region, application, role, client, or any number of other categories (as well as custom tags), and when a user is viewing the systems that Datadog monitors, they can then filter by different tags to view groups of instances and services based on different categories.
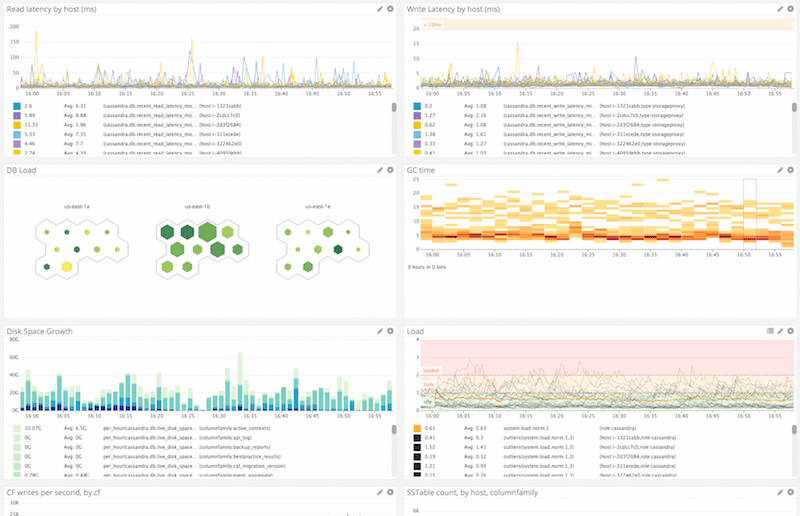
Dashboards
Datadog makes it easy to monitor AWS systems through real-time dashboards that provide visualizations of system performance, allowing for easy comparison and analysis. You can use Datadog’s preconfigured AWS dashboards or create any number of custom dashboards, tracking the performance of different types of systems or monitoring the data for one specific client and sharing it with team members via a public URL.
Dashboards can include a wide variety of helpful data, including graphs, timelines, individual metrics, heat maps, hostmaps that display how different services are related to each other, lists of the top instances by metrics like CPU usage, and much more. In addition, team members can highlight specific items or sections of a graph and add annotations, allowing for easy collaboration and communication.
Through all of these powerful tools, Datadog provides systems administrators with everything they need to stay on top of their AWS resources and applications. Do you have any questions about how Diagram manages Amazon Web Services systems? Do you want to know more about our cloud hosting services? Please contact us, and we’ll help you determine how to use these tools in your digital strategy.
Related Posts

Why Do I Need an SSL Certificate?
Without understanding what an SSL Certificate is, it may be hard to realize why this is so important for your website. In this blog Diagram will cover both of these topics.

3 Pro Tips to Make Your HubSpot Workflows Successful
HubSpot's workflows are a powerful tool for connecting with your customers. We share 3 pro tips for getting the most out of your workflows.
Results Matter.
We design creative digital solutions that grow your business, strengthen your brand and engage your audience. Our team blends creativity with insights, analytics and technology to deliver beauty, function, accessibility and most of all, ROI. Do you have a project you want to discuss?

Like what you read?
Subscribe to our blog "Diagram Views" for the latest trends in web design, inbound marketing and mobile strategy.