Using SQL Server Profiler to Collect Valuable Performance Metrics
Dan Sales#Hosting, #Hosting Insights, #Tutorials

Today, we’ll be looking at the basics of using SQL Server Profiler, including how to open SQL Server Profiler and start a trace, as well as a few simple steps to follow to make the trace a little more useful to you.
Metrics and Traces
SQL Server Profiler (which is often referred to as just Profiler) is a GUI based tool that allows for the collection of metrics showing what’s happening in SQL Server. These metrics include query duration, CPU usage, number of reads, number of writes, the name of the machine that ran the query, user account, SQL Server process ID, and many more.
Profiler also allows us to see the text of a query. On top all of all this, it gives us the ability to capture data in real time in what is called a trace. We can then go back and review the trace row by row to see if there are any performance issues related to the TSQL query being run. We can also start a trace without using the SQL Server Profiler GUI, which can be useful, but is outside the scope of this blog.
Before we get into running a Profiler trace, I should point out the one major downside of using it: Profiler captures and stores data on every event in SQL Server within the parameters of the trace template. Because of this, Profiler can use a great deal of resources on the server when a trace is running. Profiler traces should only be run on servers that have the available resources to do so, and only for the time needed to gather the necessary data.
Creating a Trace
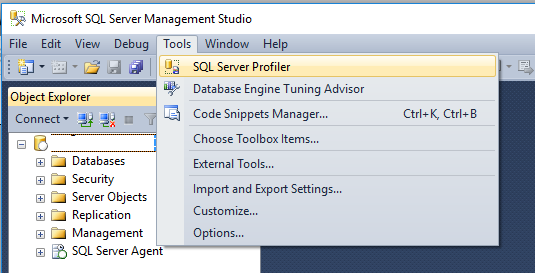
There are a number of ways to launch Profiler, and since we have been doing everything in SQL Server Management Studio to this point in this blog series, we will start there. In SQL Server Management Studio, open the Tools menu then select SQL Server Profiler:
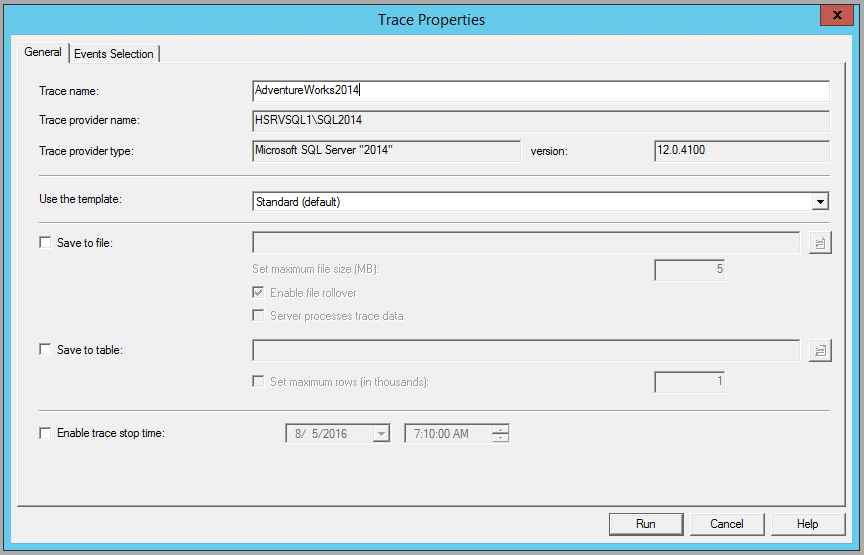
Profiler will then ask you to log into the SQL Server instance you want to run the trace on. After logging in, a new Trace Properties window will automatically open. Here, you will need to provide a name for the new trace and select a trace template.
For this example, I am going to use the AdventureWorks2014 sample database, so I will name this trace AdventureWorks2014 and use the Standard (default) template. I will not be saving this trace or sending the output to a database table, but if I wanted to, I could select those options at this time. A trace end time can also be set here, which is a good idea if a trace is going to be run unattended.
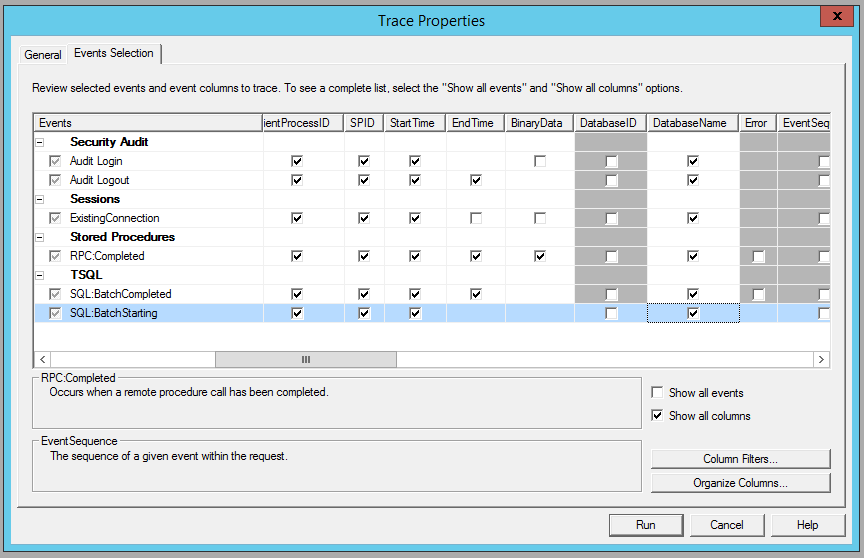
Next, I want to click on the Events Selection tab. This tab allows me to select what SQL Server events I want the trace to capture and apply filters to block out the events I do not want to capture. The default trace captures events for all databases and user accounts in the instance. I recommend always narrowing down the events captured to a specific database and/or user account when running a trace. Since I want to only see events for the AdventureWorks2014 database, I need to make a few changes to the template.
To do this, I check the “Show all columns” check box at the bottom right. I then scroll over in the Events window until I see the DatabaseName column and check all the check boxes in this column:
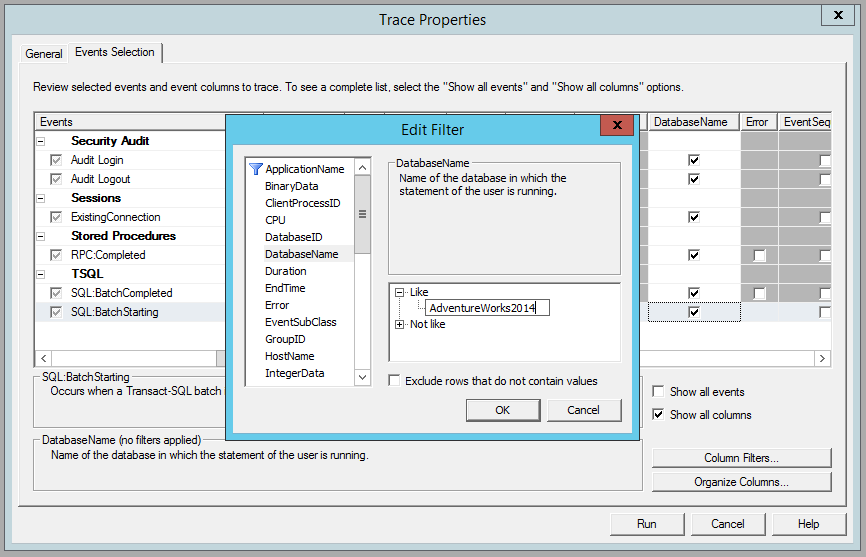
Once I have done that, I need to apply a filter to the template so I only see the event for the AdventureWorks2014 database. I can do that by either double clicking on the DatabaseName column heading or clicking on the Column Filters button at the bottom right. The Edit Filter window will pop up, and I will select the DatabaseName filter.
At this point, I have the option to filter by database names that are “like” or “not like” a value I enter. I want to see all the events for the AdventureWorks2014 database, so I will add a new filter to select events like the value ‘AdventureWorks2014’ and click OK. Then I will click the Run button to start the trace.
Running a Trace
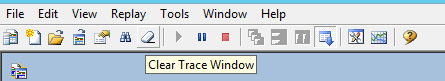
Now I have a running trace capturing events for the AdventureWorks2014 database. I can stop and start the trace as well as clear all the events in the trace using the tool bar. If I want start whole new trace, I can also do this using the tool bar.
With my new trace running, I will run a “select all” statement on the Sales.CurrencyRate table of the AdventureWorks2014 database in SQL Server Management Studio. The TSQL for this select statement is:
SELECT [CurrencyRateID]
    ,[CurrencyRateDate]
    ,[FromCurrencyCode]
    ,[ToCurrencyCode]
    ,[AverageRate]
    ,[EndOfDayRate]
    ,[ModifiedDate]
FROM [AdventureWorks2014].[Sales].[CurrencyRate]
After I run the statement, I stop the trace. Never leave a trace running unless there are events you want to capture, because it can impact the performance of the SQL Server instance. When I look at my trace, I see that it has captured the TSQL statement I just ran and a number of metrics about the execution of that statement:
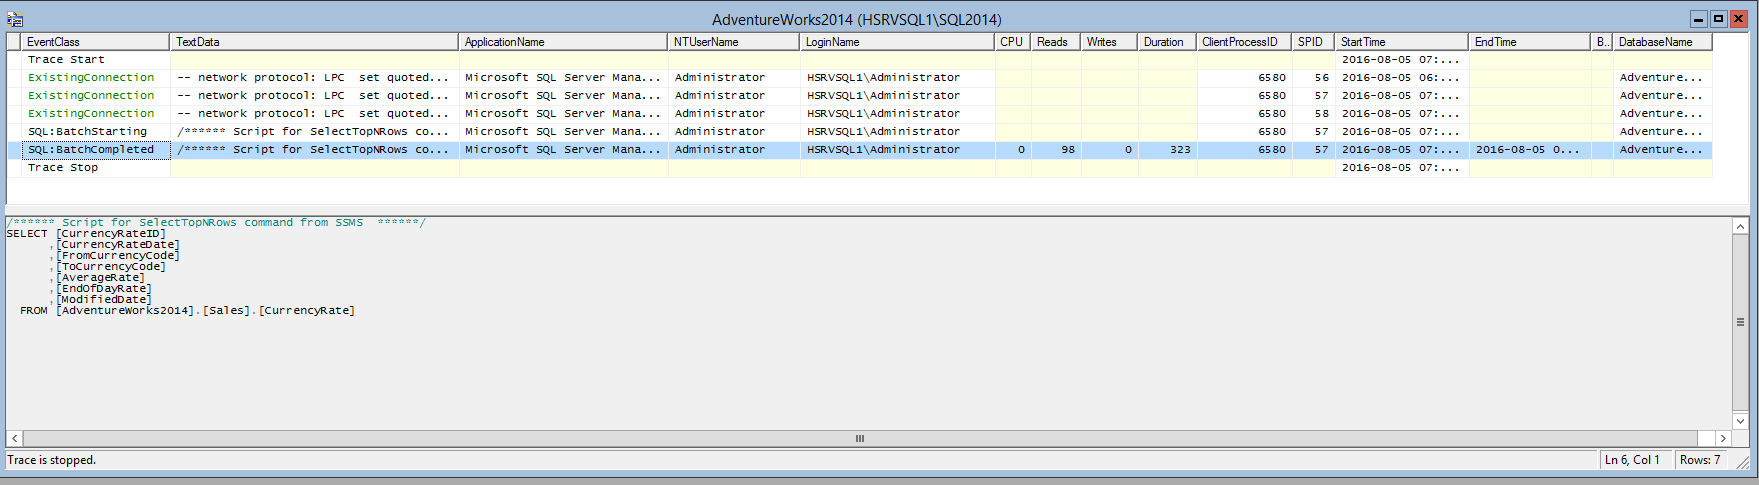
The trace has provided a wealth of useful data about the TSQL statement, such as the name of the application running the statement, user login information related to the statement, the amount of CPU used, database reads and writes used, total time to process the statement in milliseconds (Duration), the client process ID, the SQL Server process ID (SPID), and more. By clicking on reach row of the trace, I can see the details of the TSQL query that ran related to that row. In this case, by selecting the “batch completed” row of the trace, I can see the TSQL statement that was run, which is the same as the statement listed above.
I have provided a relatively simple example of a Profiler trace here, but the principle is the same for any trace you many need to run. The only real difference will be the number of events being captured by the trace. With a production database, there will be an almost constant stream of events that will quickly fill up the trace window. This is one reason why it is a good idea to run a trace only for a short period around the time when you are seeing performance issues in an application. You can then stop the trace and review it row by row once the events have been captured. Profiler also has a search function that can be very helpful. To open the search, go the Edit menu and select Find… or use the key command Ctrl+F.
SQL Server Profiler is a powerful tool that if used correctly can provide a great deal of meaningful data about what’s going on in a SQL Server instance. To learn more about SQL Server Profiler, I recommend visiting some of the links below:
- MSSQLTips - Profiler and Server Side Traces
- Microsoft Developer Network - How To: Use SQL Profiler
- SQLAuthority - SQL SERVER – Introduction to SQL Server 2008 Profiler – Complete
If you have any questions about SQL Server management, please feel free to leave a comment below. If you want to know more about how Diagram can provide hosting services and help manage your SQL Server instance, please contact us. Please stay tuned for the next installment of our series of blogs about SQL Server!
Related Posts

The 3 Main Types of SSL Certificates to Know
Learn about the 3 main types of SSL certificates to help you decide which one is best for your business.
Why Do I Need an SSL Certificate?
Without understanding what an SSL Certificate is, it may be hard to realize why this is so important for your website. In this blog Diagram will cover both of these topics.
Results Matter.
We design creative digital solutions that grow your business, strengthen your brand and engage your audience. Our team blends creativity with insights, analytics and technology to deliver beauty, function, accessibility and most of all, ROI. Do you have a project you want to discuss?

Like what you read?
Subscribe to our blog "Diagram Views" for the latest trends in web design, inbound marketing and mobile strategy.